问题定位工具
pprof
基本原理:
The builtin Go CPU profiler uses the setitimer(2) system call to ask the operating system to be sent a SIGPROF signal 100 times a second. Each signal stops the Go process and gets delivered to a random thread’s sigtrampgo() function. This function then proceeds to call sigprof() or sigprofNonGo() to record the thread’s current stack.
Since Go uses non-blocking I/O, Goroutines that wait on I/O are parked and not running on any threads. Therefore they end up being largely invisible to Go’s builtin CPU profiler.
每秒被唤醒 100 次,记录每个线程上的栈,那些等待 IO 被 gopark 之类挂起的 goroutine 不会被采集到,因为不在线程上运行,gopark 挂起 goroutine 后,当前线程一般会进 schedule → findrunnable 的调度循环。
fgprof
fgprof is implemented as a background goroutine that wakes up 99 times per second and calls runtime.GoroutineProfile. This returns a list of all goroutines regardless of their current On/Off CPU scheduling status and their call stacks.
比较类似,但是会包含那些 Off CPU 的 goroutine。比如可以结合该库与 goroutine 的增长情况来做一段逻辑:当 goroutine 突然增长时,用 fgprof 采样 x 秒,可以发现是在代码的什么位置发生了阻塞。当然,也可以直接把 pprof 的 goroutine stack 给 dump 下来。
trace
一般用来诊断一些诡异的抖动问题,或 runtime 的 bug(或者用来学习 runtime 的执行流),用来做问题诊断效果一般。
基本原理是在 runtime 中埋了大量点,记录一堆 event 来追踪 runtime 执行流程。
如果对一些调度问题有疑问,可以在 trace 里做观察,不过拿来定位问题还是比较费劲的。
perf
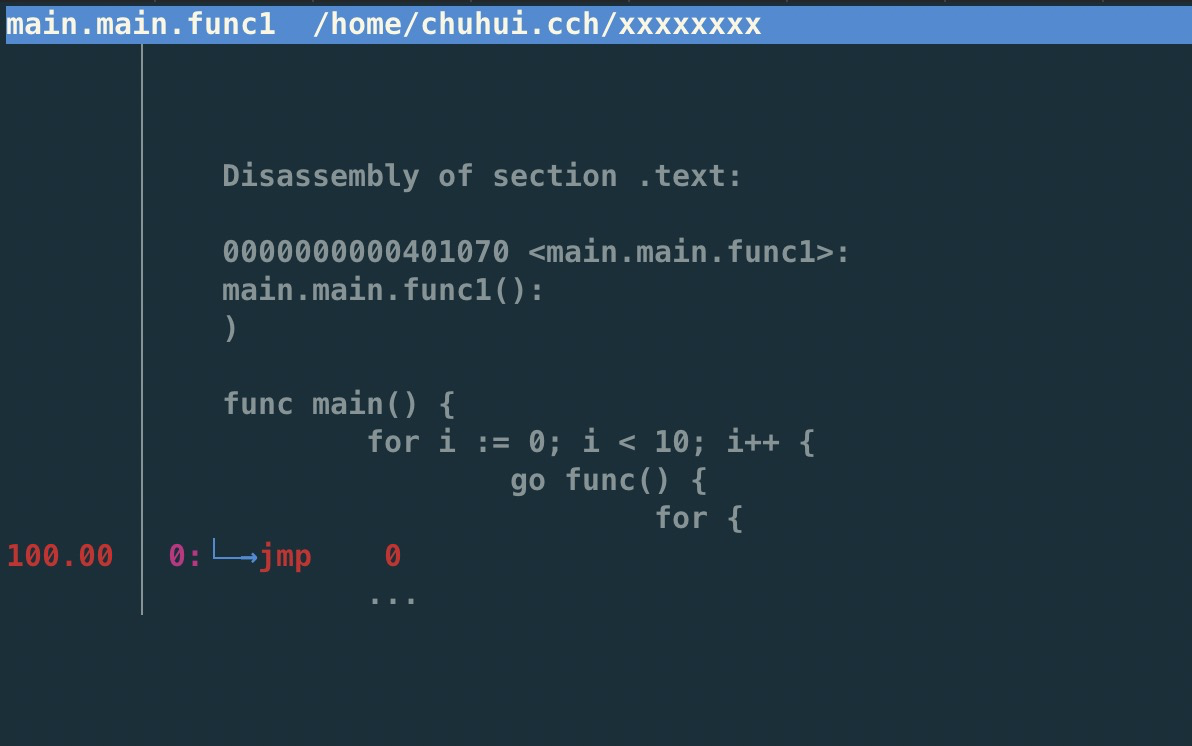
perf 也是可以用的,比如线上没开 pprof 的时候,发现 CPU 炸了,perf 可以看看到底在干啥,因为 Go 默认会把 DWARF 调试信息带进二进制文件中,通过 perf 的 zoom 功能也可以一直看到哪行代码(或者是汇编)占用了比较高的 CPU。
$ perf stat -e task-clock,cycles,instructions,cache-references,cache-misses ./hello
yyyy

 Performance counter stats for './hello':

          1.464376      task-clock (msec)         #    0.979 CPUs utilized
         3,681,288      cycles                    #    2.514 GHz
         1,722,170      instructions              #    0.47  insn per cycle
            46,475      cache-references          #   31.737 M/sec
            21,479      cache-misses              #   46.216 % of all cache refs

       0.001495925 seconds time elapsed
perf top
性能瓶颈举例
业务逻辑
|
调用外部命令 |
package main

import (
	"os/exec"
	"testing"

	uuid "github.com/satori/go.uuid"
)

var uu []byte
var u1 uuid.UUID

func BenchmarkUUIDExec(b *testing.B) {
	for i := 0; i < b.N; i++ {
		uu, _ = exec.Command("uuidgen").Output()
	}
}

func BenchmarkUUIDLib(b *testing.B) {
	for i := 0; i < b.N; i++ {
		u1 = uuid.NewV4()
	}
}
过多的系统调用
合并调用
-
如 writev,但是合并的 syscall 延迟可能会上升。
-
pipeline,一下发一堆请求,不过现在可能连 HTTP 的 pipeline 都不一定支持得好。经常被 benchmark 玩家用来刷数据。
过多的对象
|
字符串操作 |
用加号连接,和 Sprintf 差别还是比较大的:
func BenchmarkBytesBufferAppend(b *testing.B) {
	for i := 0; i < b.N; i++ {
		var msg bytes.Buffer
		msg.WriteString("userid : " + "1")
		msg.WriteString("location : " + "ab")
	}
}

func BenchmarkBytesBufferAppendSprintf(b *testing.B) {
	for i := 0; i < b.N; i++ {
		var msg bytes.Buffer
		msg.WriteString(fmt.Sprintf("userid : %d", 1))
		msg.WriteString(fmt.Sprintf("location : %s", "ab"))
	}
}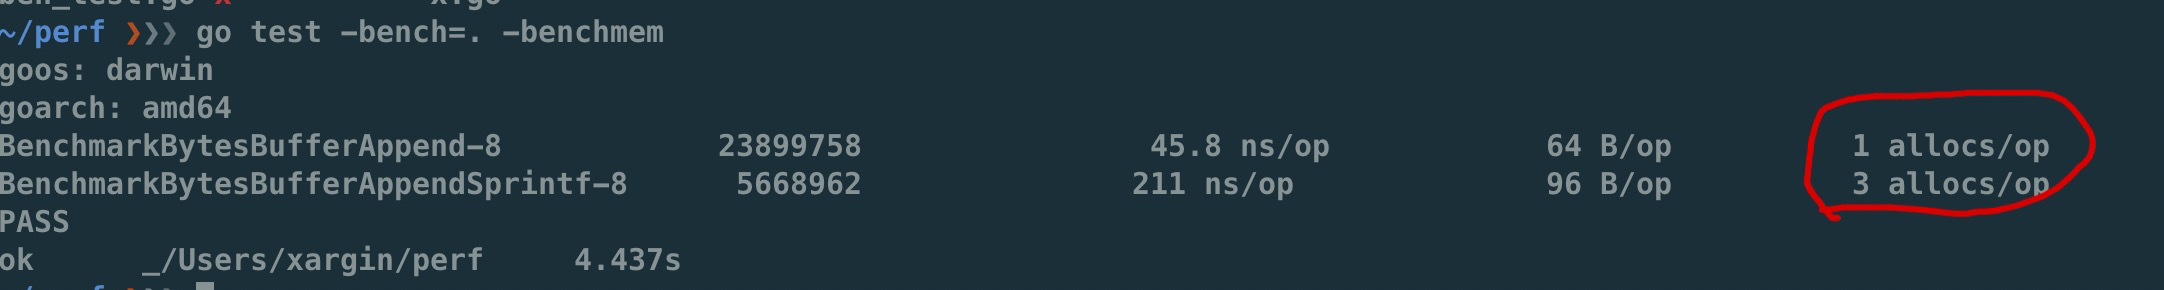
fmt.打印系列大部分会造成变量逃逸(interface 参数)。
sync.Pool
sync.Pool 才能实现 zero garbage。benchmark 中的 0 alloc,其实是因为对象有复用,alloc 平均 < 1。
struct 可以复用(p = Person{},用零值覆盖一次就可以),slice 可以复用(a = a[:0]),但 map 不太好复用(得把所有 kv 全清空才行,成本可能比新建一个还要高)。比如 fasthttp 里,把本来应该是 map 的 header 结构变成了 slice,牺牲一点查询速度,换来了复用的方便。
复用本身可能导致 bug,例如:
-
拿出时不 Reset,内含脏数据:
-
slice 缩容时,被缩掉对象如果不置 nil,是不会释放的
-
在 Put 回 Pool 时,不判断大小,导致了进程占内存越来越大(标准库发生过这样的问题,在用户看起来,整个进程占用的内存一直在上涨,像是泄露一样)
第二点可以看下面这张图理解一下:
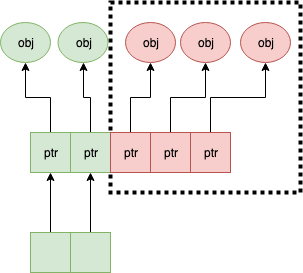
a = a[:1],如果后面的元素都是指针,都指向了 500MB 的一个大 buffer,没法释放,GC 认为你还是持有引用的。这种情况需要自己先把后面的元素全置为 nil,再缩容。
offheap
如果数据不可变,只作查询,也可以考虑 offheap,但局限性较大。
下面三个库可以看看。
最近 dgraph 有一篇[分享](https://dgraph.io/blog/post/manual-memory-management-golang-jemalloc/),用 jemalloc 和封装的 cgo 方法,可以把一些 hotpath 上分配的对象放在堆外,这个库的局限是在堆外分配的对象不能引用任何 Go 内部的对象,否则可能破坏 GC 时的引用关系。
理论上一些 QPS 较低,但每次请求很大的系统,或许可以参考这个库,把 buffer 放在堆外。
减少指针类型变量逃逸
使用 go build -gcflags="-m -m" 来分析逃逸。
如果要分析某个 package 内的逃逸情况,可以打全 package 名,例如 go build -gcflags="-m -m" github.com/cch123/elasticsql
string 类型天然就是带指针的类型,比如一些 cache 服务,有几千万 entry,那么用 string 来做 key 和 value 可能成本就很高。
|
减少指针的手段: |
用值类型代替指针类型,比如:
*int -> struct {value int, isNull bool}

string -> struct {value [12]byte, length int)

数值类型的 string -> int

*Host -> Host|
减少逃逸的手段 |
-
尽量少用 fmt.Print、fmt.Sprint 系列的函数。
-
设计函数签名时,参数尽量少用 interface
-
少用闭包,被闭包引用的局部变量会逃逸到堆上
不过这些也就说说而已,真的每一条都遵循怕是写代码的时候已经疯了。况且 Go 的 defer 只能在函数作用域内运作,为了避免 panic 死锁,很多时候套个闭包的操作还是比较常见的。
map 结构的 128 阈值
key > 128 字节时,indirectkey = true
value > 128 字节时,indirectvalue = true
我们可以用 lldb 来进行简单验证:
package main

import "fmt"

func main() {
    type P struct {
        Age [16]int
    }
    var a = map[P]int{}
    a[P{}] = 1
    fmt.Println(a)
}
在 lldb 中可以看到 indirectkey 为 false。
(lldb) b mapassign
(lldb) p *t
(runtime.maptype) *t = {
  typ = {
    size = 0x0000000000000008
    ptrdata = 0x0000000000000008
    hash = 2678392653
    tflag = 2
    align = 8
    fieldalign = 8
    kind = 53
    alg = 0x0000000001137020
    gcdata = 0x00000000010cf298
    str = 26128
    ptrToThis = 0
  }
  key = 0x00000000010a77a0
  elem = 0x000000000109d180
  bucket = 0x00000000010aea00
  hmap = 0x00000000010b4da0
  keysize = 128  =======> 128 字节
  indirectkey = false =====> false
  valuesize = 8
  indirectvalue = false
  bucketsize = 1104
  reflexivekey = true
  needkeyupdate = false
}
现在 lldb 不支持 Golang 了,在 gdb 或者 dlv 里应该也可以看到这个字段。
过多的调度 CPU 占用(例如火焰图中,schedule 有一大条)
类似 fasthttp 的 workerpool。
创建好的 goroutine 可以反复使用,并且自己实现可以控制最大的并发 worker 数。
锁冲突
通过阶梯加压,观察 goroutine 的变化趋势。当触发锁瓶颈时,会出现大量等锁的 goroutine。
原因
临界区太大,其中包含系统调用。
有些锁是避免不了的,例如 fs.Write,一定有锁,且该锁在 runtime 内部。
性能敏感场合,全局锁,比如 rand 的全局锁。单机 10w+ QPS 即可能触发该瓶颈(和环境以及程序行为有关)
type lockedSource struct {
	lk  sync.Mutex
	src Source64
}

func (r *lockedSource) Int63() (n int64) {
	r.lk.Lock()
	n = r.src.Int63()
	r.lk.Unlock()
	return
}

func (r *lockedSource) Uint64() (n uint64) {
	r.lk.Lock()
	n = r.src.Uint64()
	r.lk.Unlock()
	return
}
有些开源库设计是一个 struct 对应一个 sync.Pool,这种时候,如果你不对该 struct 进行复用,就会触发 runtime 中的锁冲突:
参考本文中的第一个案例:
程序局部性
false sharing
时间局部性、空间局部性
var semtable [semTabSize]struct {
	root semaRoot
	pad  [cpu.CacheLinePadSize - unsafe.Sizeof(semaRoot{})]byte
}
var timers [timersLen]struct {
timersBucket
// The padding should eliminate false sharing
// between timersBucket values.
pad [cpu.CacheLinePadSize - unsafe.Sizeof(timersBucket{})%cpu.CacheLinePadSize]byte
}类似下面的二维数组,怎么遍历更快?
var a = [10000][10000]int{}在标准库中,考虑到局部性而实现的 sort 的例子:
func quickSort_func(data lessSwap, a, b, maxDepth int) {
	for b-a > 12 {
		if maxDepth == 0 {
			heapSort_func(data, a, b)
			return
		}
		maxDepth--
		mlo, mhi := doPivot_func(data, a, b)
		if mlo-a < b-mhi {
			quickSort_func(data, a, mlo, maxDepth)
			a = mhi
		} else {
			quickSort_func(data, mhi, b, maxDepth)
			b = mlo
		}
	}
	if b-a > 1 {
		for i := a + 6; i < b; i++ {
			if data.Less(i, i-6) {
				data.Swap(i, i-6)
			}
		}
		insertionSort_func(data, a, b)
	}
}timer 性能问题
-
老版本的 timer 会有高压力下触发不准时问题,且触发大量的 syscall → Go issue 25471
// xiaorui.cc

go1.13

% time     seconds  usecs/call     calls    errors syscall
------ ----------- ----------- --------- --------- ----------------
 84.00   12.007993         459     26148      3874 futex
 11.43    1.634512         146     11180           nanosleep
  4.45    0.635987          32     20185           sched_yield

go1.14

% time     seconds  usecs/call     calls    errors syscall
------ ----------- ----------- --------- --------- ----------------
 58.78    4.837332         174     27770      4662 futex
 19.50    1.605189         440      3646           nanosleep
 11.55    0.950730          44     21569           epoll_pwait
  9.75    0.802715          36     22181           sched_yield:w
优化后,CPU 占用降低,到时不触发的问题也有所改善。更具体的可以参考 这篇文章。
-
用时间轮实现粗粒度的时间库
可以搜搜大量的 timewheel 库。
ticker 使用时要尤其注意泄露问题,否则程序 CPU 使用会逐渐上涨:
package main

import (
    "fmt"
    "time"
)

func main() {
    for {
        select {
        case t := <-time.Tick(time.Second * 2):
            fmt.Println(t, "hello world")
        }
    }
}语言本身的一些缺陷
越压越差
runtime 虽然会对 g 结构体进行 cache 和复用,但在瞬时的高峰时,可能产生同时在执行的大量 goroutine,这些 goroutine 会导致:
var (
	allgs    []*g
	allglock mutex
)
runtime 中上面的 allgs 这个数组变大,比如你并发产生了 100000 个 goroutine,那么在高峰过后,即使不再服务任何请求,你的进程占用的 CPU 也会比高峰之前多。
package main

import (
	"log"
	"net/http"
	_ "net/http/pprof"
	"time"
)

func sayhello(wr http.ResponseWriter, r *http.Request) {}

func main() {
	for i := 0; i < 1000000; i++ {
		go func() {
			time.Sleep(time.Second * 10)
		}()
	}
	http.HandleFunc("/", sayhello)
	err := http.ListenAndServe(":9090", nil)
	if err != nil {
		log.Fatal("ListenAndServe:", err)
	}
}
可以在你的机器上跑跑上面这个程序,用下面的 python 脚本来验证:
import psutil
import time

p = psutil.Process(1) # 改成你自己的 pid 就行了

while 1:
    v = str(p.cpu_percent())
    if "0.0" != v:
        print(v, time.time())
    time.sleep(1)
调度和锁
调度 + 锁出问题,难复现,难定位。
比如高压力下,刚拿到锁就被调度走了,且导致大量的其它需要获取锁的 goroutine 阻塞。
Authors of parallel programs have known for decades that performance can suffer badly if a thread is preempted while holding a lock; this is sometimes referred to as inopportune preemption.
调度导致 CPU 密集型业务超时
package main

import "fmt"
import "golang.org/x/crypto/bcrypt"
import "time"

func test(cost int, id int) {
	startTime := time.Now()
	code, _ := bcrypt.GenerateFromPassword([]byte("password"), cost)
	fmt.Println(time.Since(startTime), "END test ", id, code[0])
}

func main() {
	startTime := time.Now()
	code, _ := bcrypt.GenerateFromPassword([]byte("password"), 15)
	fmt.Println(time.Since(startTime), "END test ", -1, code[0], "\n")

	// 修改 4 为不同的值,猜猜结果?
	for i := 0; i < 4; i++ {
		go test(15, i)
	}
	time.Sleep(1e16)
}
补充知识
怎么阅读 pprof 的文本格式的 dump
下面是 heap profile 的 dump 结果,我们需要重点关心的是里面的几个数值:
94(94 个 inuse objects): 6160384(6MB inuse space) [5828(5828 个 alloc objects): 381943808(381M 的 alloc space)] @ 0x1370f09 0x1397394 0x1396b32 0x1395e65 0x13981ab 0x13a313a 0x13a9c60 0x13a9401 0x13b4125 0x1703b69 0x1703b0b 0x170cdd1 0x170fcb7 0x170f90d 0x174e369 0x1510930 0x150b5a5 0x17ad46c 0x179fc0e 0x17b1958 0xf43e70 0x49b481 _
后面这些指的是程序的代码地址,Go 可以根据这些地址在 .text 段中找到具体的代码位置。
---
profile : heap profile: 1240: 51385648 [50587184: 280604213336] @ heap/1048576
94: 6160384 [5828: 381943808] @ 0x1370f09 0x1397394 0x1396b32 0x1395e65 0x13981ab 0x13a313a 0x13a9c60 0x13a9401 0x13b4125 0x1703b69 0x1703b0b 0x170cdd1 0x170fcb7 0x170f90d 0x174e369 0x1510930 0x150b5a5 0x17ad46c 0x179fc0e 0x17b1958 0xf43e70 0x49b481
#    0x1370f08       gitlab.outer.com/ooh-mesh/mosn/vendor/gitlab.outer.com/oooo/redis-go-client/async.NewAsyncClient+0x208                      /go/src/gitlab.outer.com/ooh-mesh/mosn/vendor/gitlab.outer.com/oooo/redis-go-client/async/async_client.go:55
#  0x1397393       gitlab.outer.com/ooh-mesh/mosn/vendor/gitlab.outer.com/oooo/redis-go-client.(*ClientPool).newAsyncClient+0x73               /go/src/gitlab.outer.com/ooh-mesh/mosn/vendor/gitlab.outer.com/oooo/redis-go-client/client_pool.go:110
#        0x1396b31       gitlab.outer.com/ooh-mesh/mosn/vendor/gitlab.outer.com/oooo/redis-go-client.(*ClientPool).takeClient+0x3f1                  /go/src/gitlab.outer.com/ooh-mesh/mosn/vendor/gitlab.outer.com/oooo/redis-go-client/client_pool.go:66
# 0x1395e64       gitlab.outer.com/ooh-mesh/mosn/vendor/gitlab.outer.com/oooo/redis-go-client.(*ClientHandler).takeClient+0x1b4               /go/src/gitlab.outer.com/ooh-mesh/mosn/vendor/gitlab.outer.com/oooo/redis-go-client/client_handler.go:46
#      0x13981a gitlab.outer.com/ooh-mesh/mosn/vendor/gitlab.outer.com/oooo/redis-go-client.(*CommandExecutor).do+0x1ba                     /go/src/gitlab.outer.com/ooh-mesh/mosn/vendor/gitlab.outer.com/oooo/redis-go-client/command_executor.go:58
#    0x13a313 gitlab.outer.com/ooh-mesh/mosn/vendor/gitlab.outer.com/oooo/redis-go-client.(*TBaseClient).Do+0x99                          /go/src/gitlab.outer.com/ooh-mesh/mosn/vendor/gitlab.outer.com/oooo/redis-go-client/redis_client.go:73
#        0x13a9c5 gitlab.outer.com/ooh-mesh/mosn/pkg/upstream/zcache/client.(*RedisClientInterceptor).Do+0x13f                                        /go/src/gitlab.outer.com/ooh-mesh/mosn/pkg/upstream/zcache/client/redis_client_interceptor.go:29
#      0x13a9400       gitlab.outer.com/ooh-mesh/mosn/pkg/upstream/zcache/client.(*RedisClientDelegate).GetTsEx+0x120                                      /go/src/gitlab.outer.com/ooh-mesh/mosn/pkg/upstream/zcache/client/redis_client_delegate.go:33
# 0x13b4124       gitlab.outer.com/ooh-mesh/mosn/pkg/upstream/zcache/cachemanager.(*TBaseCacheManager).GetTsEx+0x1c4                                  /go/src/gitlab.outer.com/ooh-mesh/mosn/pkg/upstream/zcache/cachemanager/redis_cache_manager.go:96
#     0x1703b68       gitlab.outer.com/ooh-mesh/mosn/pkg/upstream/zcache/cachemanager.(*RefreshableTBaseCacheManager).GetTsEx+0x98                        /go/src/gitlab.outer.com/ooh-mesh/mosn/pkg/upstream/zcache/cachemanager/refreshable_redis_cache_manager.go:55
# 0x1703b0a       gitlab.outer.com/ooh-mesh/mosn/pkg/gateway/integrate.(*ZCacheClient).GetObjectLDC+0x3a                                              /go/src/gitlab.outer.com/ooh-mesh/mosn/pkg/gateway/integrate/zcacheclient.go:67
#       0x170cdd0       gitlab.outer.com/ooh-mesh/mosn/pkg/gateway/session.queryAlipaySessionById+0x790                                                     /go/src/gitlab.outer.com/ooh-mesh/mosn/pkg/gateway/session/mobile_session_manager.go:42
#       0x170fcb6       gitlab.outer.com/ooh-mesh/mosn/pkg/gateway/session.getAlipaySession+0x186                                                           /go/src/gitlab.outer.com/ooh-mesh/mosn/pkg/gateway/session/session_manager.go:35
#      0x170f90c       gitlab.outer.com/ooh-mesh/mosn/pkg/gateway/session.InitSession+0x3c                        /go/src/gitlab.outer.com/ooh-mesh/mosn/pkg/gateway/session/session_manager.go:14
#      0x174e368       gitlab.outer.com/ooh-mesh/mosn/pkg/gateway/handler.(*SessionHandler).HandleIn+0x618                                         /go/src/gitlab.outer.com/ooh-mesh/mosn/pkg/gateway/handler/session_handler.go:32
#      0x151092f       gitlab.outer.com/ooh-mesh/mosn/vendor/gitlab.outer.com/ooh-mesh/sofa-mosng/pkg/gateway.(*DefaultPipeline).RunInHandlers+0xcf   /go/src/gitlab.outer.com/ooh-mesh/mosn/vendor/gitlab.outer.com/ooh-mesh/sofa-mosng/pkg/gateway/pipeline.go:45
#    0x150b5a4       gitlab.outer.com/ooh-mesh/mosn/vendor/gitlab.outer.com/ooh-mesh/sofa-mosng/pkg/gateway.(*GatewayFilter).OnReceive+0x3c4        /go/src/gitlab.outer.com/ooh-mesh/mosn/vendor/gitlab.outer.com/ooh-mesh/sofa-mosng/pkg/gateway/filter.go:89
#      0x17ad46b       gitlab.outer.com/ooh-mesh/mosn/vendor/mosn.io/mosn/pkg/proxy.(*downStream).runReceiveFilters+0xdb                                   /go/src/gitlab.outer.com/ooh-mesh/mosn/vendor/mosn.io/mosn/pkg/proxy/streamfilters.go:50
#      0x179fc0d       gitlab.outer.com/ooh-mesh/mosn/vendor/mosn.io/mosn/pkg/proxy.(*downStream).receive+0x24d                                            /go/src/gitlab.outer.com/ooh-mesh/mosn/vendor/mosn.io/mosn/pkg/proxy/downstream.go:404
#        0x17b1957       gitlab.outer.com/ooh-mesh/mosn/vendor/mosn.io/mosn/pkg/proxy.(*downStream).OnReceive.func1+0xd7                                     /go/src/gitlab.outer.com/ooh-mesh/mosn/vendor/mosn.io/mosn/pkg/proxy/downstream.go:373
#        0xf43e6f        gitlab.outer.com/ooh-mesh/mosn/vendor/mosn.io/mosn/pkg/sync.(*workerPool).spawnWorker+0x4f                                          /go/src/gitlab.outer.com/ooh-mesh/mosn/vendor/mosn.io/mosn/pkg/sync/workerpool.go:169
推荐材料: